National Technologies, Inc
Team Advanced Statistics


| Wins/Losses |
18-4 |
| Extra Inning Games |
4-0 |
| Runs per Game |
12.8 |
| Most Hits |
31 |
| Most Runs |
23 |
| Most Hits |
84 |
| Most Runs |
55 |
| Fewest Hits |
22 |
| Fewest Runs |
15 |
| Most Hits |
10 |
| Most Runs |
9 |
| Consecutive with Hit |
24 |
| Consecutive with Run |
6 |
| Consecutive without Hit |
4 |
| Consecutive without Run |
13 |
| Largest Win Margin |
19 |
| Largest Loss Margin |
12 |
| Consecutive Wins |
6 |
| Consecutive Losses |
1 |
| Average Win Differential |
6.6 |
| Average Loss Differential |
9.3 |
| Matt Budnik |
19 |
0 |
5 |
7 |
9 |
7 |
21 |
13 |
| Dave Budnik |
22 |
0 |
7 |
7 |
10 |
6 |
21 |
15 |
| Mike Budnik |
15 |
0 |
6 |
9 |
10 |
9 |
22 |
17 |
| Jake Beilfuss |
6 |
0 |
6 |
6 |
8 |
4 |
17 |
10 |
| Jim Hoth |
15 |
1 |
10 |
12 |
9 |
6 |
23 |
12 |
| Ron Hill |
6 |
0 |
5 |
12 |
6 |
4 |
10 |
7 |
| Mike Danko |
1 |
0 |
2 |
3 |
5 |
3 |
5 |
3 |
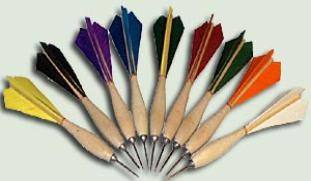
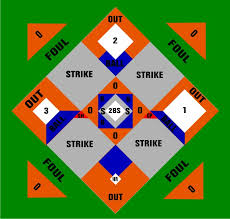 Wisconsin Dartball